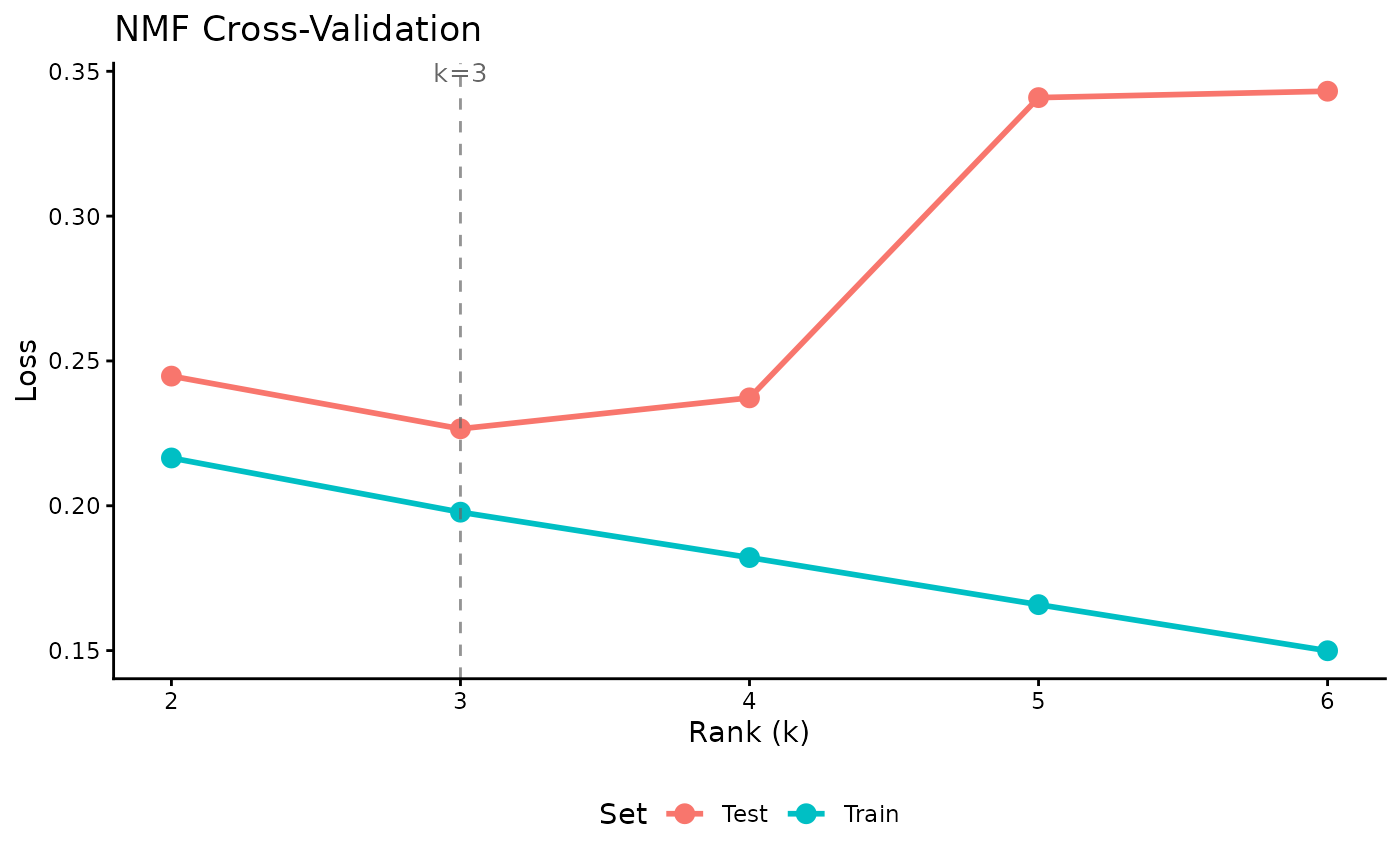
Visualize NMF cross-validation results showing test (and optionally train) loss across candidate ranks. Useful for selecting the optimal factorization rank.
Usage
# S3 method for class 'nmfCrossValidate'
plot(x, show_train = NULL, point_size = 3, interactive = FALSE, ...)
Arguments
- x
object of class
nmfCrossValidate(a data.frame fromnmf(k = 2:10, test_fraction = 0.1))- show_train
logical, overlay train loss on the plot (default TRUE if
train_msecolumn is available and non-NA)- point_size
size of data points (default 3)
- interactive
create interactive plotly plot (default FALSE)
- ...
additional arguments (unused)