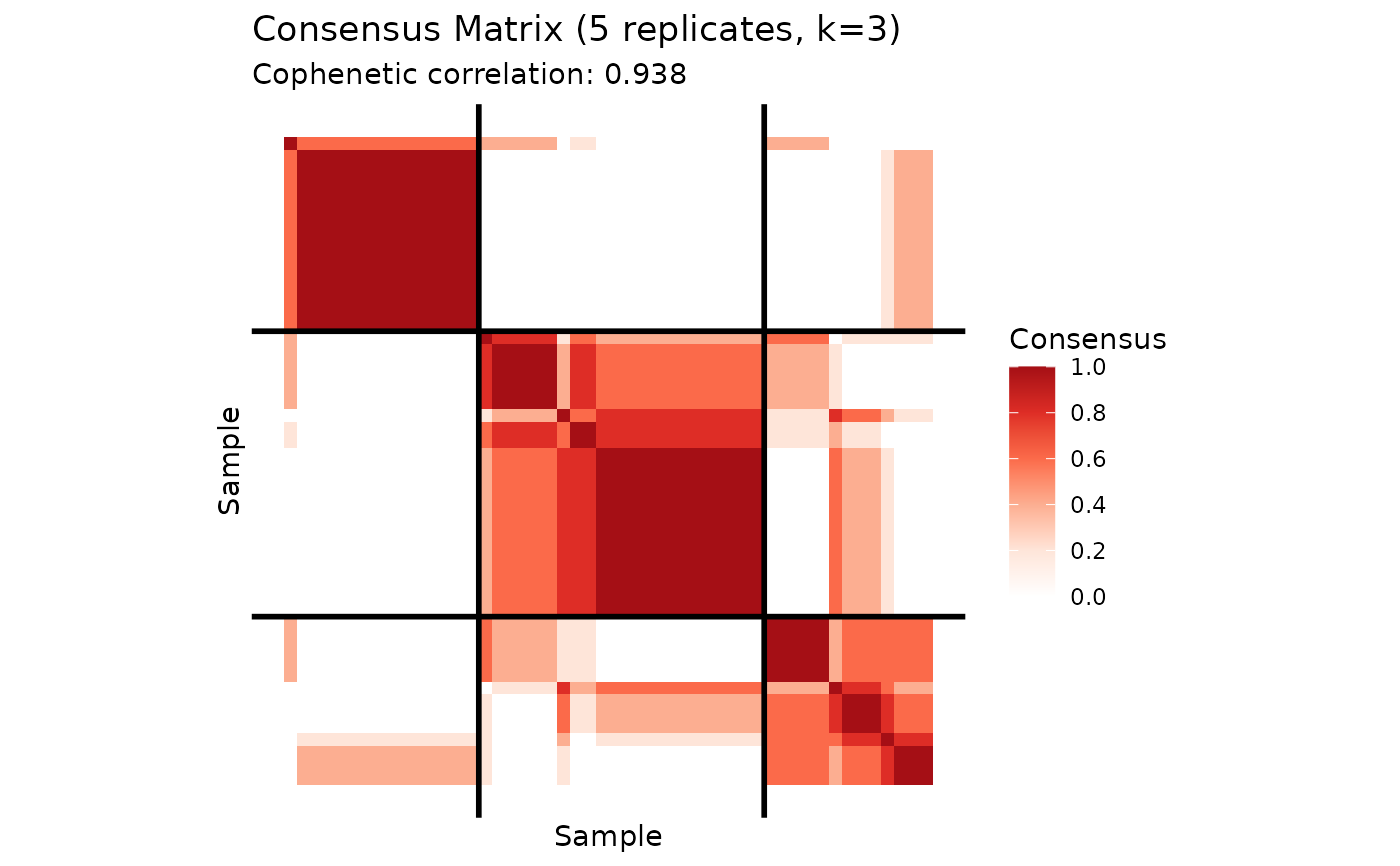
Plot Consensus Matrix Heatmap
Arguments
- x
consensus_nmf object
- cluster_rows
whether to reorder rows by hierarchical clustering (default TRUE)
- cluster_cols
whether to reorder columns (default TRUE, same as rows)
- show_clusters
whether to show cluster assignments as sidebar (default TRUE)
- color_palette
color palette name or vector of colors
- interactive
whether to make interactive plotly heatmap (default FALSE)
- ...
additional arguments (unused)
Examples
# \donttest{
library(Matrix)
A <- rsparsematrix(50, 30, 0.3)
cons <- consensus_nmf(A, k = 3, reps = 5, seed = 42)
if (requireNamespace("ggplot2", quietly = TRUE)) {
  plot(cons)
}

# }
# }